Why the 1959 drought may return in 2019/20
WEDNESDAY JANUARY 03, 2018
The
following is a selection of notes about upcoming planetary cycles and their
possible effects on weather in the longer term. It was written in May,
2014.
Weather is determined by astronomical and physical reasons which are under fixed cyclic control. Predictions of potentials and trends is possible from analysing factors that produced weather in past years.
Despite
what climatologists would have us believe, the weather is not determined by any
activities by Man. Whilst today's weather technology may be said to
be technologically advanced, useful forecasting has not progressed at all in
the past 170 years, and forecasting accurately for more than three days ahead
is still just as problematical for the meteorologists as it was in the 1850s, when
the British Meteorological Office started.
Before
that, long-range forecasting was what astrologers indulged in. By astrology, I
do not mean your star sign or your love life, for astrologers were many and
varied, and the word referred to the scientists of the day who worked out
future weather using cycles, astronomical facts, the sun and the moon, and
observations based on commonsense. So why did it fall into misuse?
The
meteorologists of the day were fighting the astrologers because the astrologers
were having too many successes in predicting storms. The problem was political
and led by one Admiral Fitzroy, a deeply religious fanatic who did not accept
that prediction of the weather was possible. Fitzroy believed that the Will of
God ruled everything, or the Hand of God, and man could not predict what God had ordained.
The situation is still political, rather than scientific, and Environmentalism has replaced religion. Farming
is no longer the prerogative of most of the population, and true longrange
weather science no longer enjoys such popularity. As it would have been
known to ancient peoples has now largely been lost.
From
the dawn of time the Sun has always been the prime mover of weather, today it
is the notion of a heavier-than-air “trace” gas called carbon dioxide.
CO2 is absent in 99.96% of
the atmosphere, and methane is one millionth, and yet we are encouraged
to believe that between them the two gases have a controlling effect on the
climate. That means 0.04% and 0.000001 respectfully, which is plainly absurd. But it is merely the latest source of tax revenue.
If
we are ever to plan ahead for major droughts, measuring the effects of amounts
of a negligible “greenhouse” gas is never going to advance it.
There
is space weather, climatic weather and everyday weather. The
weighting
system
is suggested as follows:
1.
Changes to whole planet:
(Irrespective of
geography and nothing to do with the activities of Man)
-
Deviation of Earth’s rotational
axis to the vertical.
-
Variation of Earth’s
orbit.
-
Magnetosphere
-
Heliosphere
2.
Climate at location:
(long-term
trends in weather-patterns, nothing to do with activities of Man)
-
Proximity to equator (angle
of the sun’s rays – latitude)
-
Direction of prevailing winds
-
Topographic factors – shape of
land, proximity to other land masses, elevation and distance from coast
3.
Weather at location:
(Trends
and daily occurrences, nothing to do with activities of Man)
-
Influence of Moon on tides
(including air tides), rain from ocean, and back to ocean. (80-85%), also ocean
cycles e.g. El Nino
-
Level and intensity of cloud
cover (keeps heat in, determines what, where, when of rain (15%)
-
Solar winds, cycles of sunspots (5%
because of
infrequency)
4.
Not in the mix at all, either for climate or weather
-
Land use changes, deforestation
and greenification
-
Volcanic activity
-
Ice-reflectivity feedback
-
Industrial and commercial pollution
-
other activities of Man e.g.
diet
Immediate
weather is modified by cycles of solar activity (position and number of
occurring sunspots), and the cyclic position of the moon relative to the earth.
Solar influences determine major droughts. Sunspots are dark blotches on the
part of the sun corresponding to the tropical zone of the Earth, and are
cyclonic on the sun. Like on earth, where cyclones are very rarely seen on the
equator, sunspots are seldom seen on the equator of the sun. Sunspots have a
fixed swaying motion whereas cyclones on earth move, either north or south away
from the equator in a parabolic fashion.
A student
of Clement Wragge, Australian Inigo Jones, rose through forecasting
success due to his own research, to achieve respect in both the
astronomical world and the agricultural community. The Australian
government contributed to his Cromahurst Observatory in Queensland and
Australian meteorologists regularly incorporated positions of planets and moon
into their forecasting leading up to 1950 (ref: Jennifer Marohasy). Jones
had added much to long-range drought predictions using the cycles of planets,
having noted that the phases of the moon occupied the same time periods as did
the sunspots pass from quadrant to quadrant of the sun. The same cycles apply to
all forecasting.
These
days the work of Inigo Jones is slowly fading into obscurity. Weather
forecasting runs in fashions. A sun-driven idea of weather was replaced by a
meteorology that relied only on data from gathering stations and on long-term
averages for forward projections. Then came the Green agenda
of climatology. Attracting media attention brings funding
and the global warming deception has come close to replacing proper
meteorology.
Sunspots
have a cycle of 9-14 years, averaging about 11 years. 23 years gives better
indication. No sunspots is the sunspot minimum. Sunspots are on the wane when
they appear sparsely in higher latitudes around 40deg north or south. After
solar minimum, 4 or 5 years elapse until sunspot maximum, with spots nearer the
sun's equator. Then they gradually decline in number although still near to the
sun's equator, until minimum is reached. This decline is about 7 years.
Intensity
has connection to the sunspot cycle. The moon is a planet like earth, also
orbiting the sun, such that Earth holds the moon to its own orbit, so earth and
moon orbit the sun together. The moon is tied to both earth and the sun, and
alternately absorbs and shields solar electro-charges, according to moon phase.
By this process the moon controls timing of weather events.
The sun is the engine
and the moon is the driver.
Sunspots
have been shown to be electromagnetic disturbances produced by external charges
which act on the sun's internal structure. Just as sun and moon, either both on
one side of Earth (new moon) or on opposite sides (full moon) cause internal
stress on Earth to raise tides in land, sea and air, by the same process the
largest of our solar system's planetary bodies on one side of the sun or
on opposite sides cause exaggerations in sun-tides manifesting as
sunspots/solar wind.
When
the planet Jupiter draws the sun outwards from its normal line, sunspot maxima
occurs, and when the sun is drawn inwards the minima is the result. When the
gas giants Jupiter and Saturn pass across the line of the sun's advance (Solar
Apex), sunspot minimum is very close to that date. Jupiter, Saturn, Uranus and
Neptune, in that order affect the sun the most, with a period of 178 years,
roughly 10 lunar cycles. On the whole the 11-12-year sunspot period is the same
as the orbit of Jupiter, and any variations are due to the varying positions of
the other three great planets.
With
each passage of Jupiter, either just before or just after, there is usually a
major drought in Australia and indirectly affects NZ. In the
prolonged drought of 1862, Jupiter and Saturn lined up on one side of the sun
in that year. Both straddled the sun in 1871, were on one side of the sun
1900-2, then on opposite sides of the sun in 1931. Jupiter/Saturn together go
through this cycle every 35-36 years, and the other two planets, Uranus and
Neptune, are of much lesser importance. Jup/Sat are together again on one side
of the sun in 2020.
The
sun is also on a 7deg tilt to earth, which must be added or subtracted from
Earth's own tilt of 23deg. The difference between spring and autumn is because
in our spring southern sunspots are turned more away from Earth's southern
hemisphere, and are more directed towards us in our autumn.
The
main cycle seems to be 71 years and two months, which is 6 revolutions of
Jupiter, 6 solar cycles, and 4 lunar cycles. This takes May 2014 back to March
of 1943 in which there was much rain for the SW corner of WA. December 1942 was
very wet for Queensland, which matches April-May 2014.
In
1982, Saturn/Jupiter were on the same side of the sun and a severe drought
happened in the Waimea. In 2001 Jupiter crossed the vertex, bringing drought to
NZ. When Jupiter crosses the path of the sun there is a drought just
beforehand. Jupiter was crossing the sun in 2007, when world-wide droughts
brought a food crisis, sparking riots and the Murray Darling had the lowest
inflows on record. Why? No sunspots can mean little or no rain.
Large
spots can mean much rain. Flood years are around the time of max sun spots
(2014). Jupiter’s next path-cross is in 2019. If Jupiter and Saturn are
together on one side of the sun, this also can mean drought, and the next time
for this may be within a year or so of 2020.
To
make an estimate for, say, the year 2014, first look at the season of 1943
remembering that it may be 2 months later if it does not happen in the same
month. Then see what difference there was in 1979, as that may show whether the
1943 rains had the same components. Then see what happened in 1955 which is a
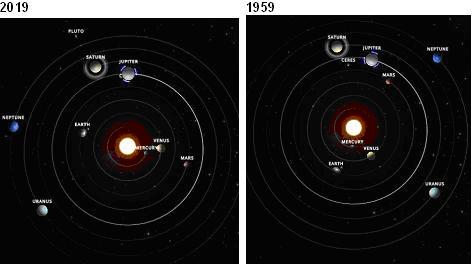
solar cycle later. At the same time take note what occurred in 1930-1 and 1896
if you can get the records. Both 1955 and 2014 have Jupiter and Saturn in same
positions. As 1955 was 4 years before a major drought, so may 2014
be. Note the relative positions of Jupiter and Saturn in the below years.
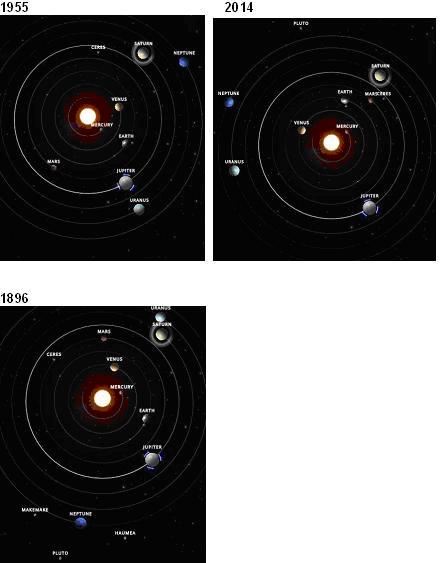
About 5 years on from 1896 the Great Federation Drought began taking hold in Australia. 1896-7 was an El Nino year, as 2015 may also be. Also, t
he 60-year cycle in yearly values of sunspot numbers is recorded by many ancient calendars. The 60 year periodicity influences large scale atmospheric circulation.
1959 is 60 years back from 2019. 1959 saw one of the biggest droughts in history. The dustbowl reached from Newcastle Waters to the Queensland border and beyond. Cattle died in thousands in WA. In NZ, the drought spanned September 1958 to March 1959, very serious over much of NZ by October. AwatereValley (Marlborough) was still affected the following March. Note Saturn and Jupiter here:
El
Ninos
The
1982 Peruvian El Nino (unwanted baby boy child) experience may have skewed
perceptions. Perhaps we should be looking at La Nina rather than El Nino. The
reason is that La Nina is the stronger of the two systems, being the normal
situation of strong easterly flows. There are twice as many weak La Nina years
as there are weak El Nino years. But there are about equal moderate to strong La
Nina and El Nino years. Mariners have always known about the ‘trade’ winds,
blowing strongly westward along the equatorial band, which are essentially La
Nina. We can say that La Nina is like the planks on a deck, with the El Nino
more akin to the gaps between them. This is a reverse perception to what we
have been lead to believe.
Staying
with the moon and taking note of averages of perigees over a year yields how in
one particular year the moon may be averagely closer to earth. These are when perigees
occur as the declination over the equator sees the moon rising due east, in the
8.85-year cycle that sees the moon swapping earth hemispheres and spending
around 2 years in each hemisphere and 2 years around the equator. The closest
averagely shorter earth-moon distance apart years over the past century or so
have been 1905, 1922, 1940, 1958, 1976, 1993, 2011, and 2029. On or just after
averagely closer perigee years, El Nino has occurred on 1905/6, 1923-6, 1940-2,
1957-8, 1976-7, 1994-5 and 2014-15.
These
closest perigee-years happen typically when the moon is at or near minimum
declination. It is around these years that the moon's inter-latitudinal range
is narrower and the speed of changing hemispheres in the course of monthly
declination is slower. Although long-term data is lacking we can assume such
years tend more towards the slackening of sea currents due to a more sluggish
lunar lateral pull, and therefore more tendency towards El Nino systems.
This
also brings the 35-year Bruckner Cycle into focus because it is almost
identical to the 35.4 year tidal period. In 1958 maximum sunspots occurred.
This culminated in Jupiter, Saturn and Uranus peaks. There was an extensive
drought in many parts of the world. The last time this came close to happening
was 1901, the year of the Great Federation Drought.
19
years, the lunar Metonic Cycle, is the period between the conjunctions of
Jupiter and Saturn. That is to say, between the times when they are nearest
to one another as they revolve round the sun. The Bruckner cycle of 35½ years
is the period required for three revolutions of Jupiter and 38 years for the
interval between three consecutive conjunctions of Saturn and Jupiter.
A
cycle of about 76 years shows rather conspicuously in the records of the
Nile annual flood levels, but this also is a multiple of the Jupiter-Saturn
conjunction period 19 x 4.76, and is slightly in excess of six revolutions of
Jupiter's 71¼ years. After Jupiter crosses the sun's path, sunspots drop which
previously may have shown great activity.
Solar
cycles peak when earth-moon distance is on the decrease, when the moon is
coming "in from the cold" as it were. Solar peaks are closer to La
Nina than El Nino, which has some bearing on the phenomena of ocean currents
and therefore sea surface temperatures. Strongest El Ninos form either just
after solar minima or on the rising side of sunspot cycles.
All
cyclic data points to El Nino kicking in about July 2015 and continuing at
least until the following Christmas. The next lunar declination minimum is
2015. The next solar minimum begins in 2015. From 1957 to 1998 spans 40 years
and 5 strong, 5 moderate and 4 weak El Ninos. This makes for an oscillation
alert each 2.5 years. If we take the 5 strong and 5 moderate events we get an
average of significant El Nino-type cycle of 4-5 years, which is a multiple of the lunar declination cycle.
As
oscillations are a function of ocean currents sea surface temperatures are not
too reliable, as other factors modify air temperatures, such as solar
intensity. 2014’s solar intensity is not a good match with either 1997 nor
1982. 1997 was on the rising side of the sunspot cycle, a quarter of the way
in. 1982 was halfway into the decline of cycle #21.
Jupiter
has been at high peaks in 1766-69, 1779-81, 1790-93, 1802-4(drought Jup+Sat),
1814-17 (drought), 1827-30 (drought), 1838-40(Jup+Sat drought), 1850-52,
1862-64, 1873-76, 1885-88, 1887-1900, 1909-12, 1921-23, 1933-35, 1945-47,
1957-59, 1968-71, 1980-83, 1992-95, 2004-6, 2016-19 (all drought years).
Low Jupiter peaks have been 1774, 1786, 1798, 1809, 1821, 1833, 1845, 1857,
1881, 1904, 1928, 1939-40, 1952, 1964, 1976, 1987, 1999, 2011 and 2023.
Jupiter/Saturn
peaks and conjunctions have been blamed for low yields and economic panic.
Examples have been 1873, 1884, 1893, 1900-2, 1907, 1910, 1931?, 1948?,
19658-60, 1987, 1990, 1999, and the recession of 2011-12. But by far the worst
have been 1901 and 1959. The next is 2016-2023 as El Nino combines with solar
minimum to create potential for worldwide droughts through low rainfall and low
agricultural yields. This may have far reaching effects worldwide. Closer
perigees in minimum declination years typically bring longer lasting extreme
events.
Rather
than fear-mongering, if one is a farmer this may be information that may be
useful. By farming with cycles, selling land before it becomes unproductive
arguably makes good sense. Other forecasters warn in the short term about
gales, cyclones, floods or snow dumps about to cross the coastlines so there is
no harm looking a bit beyond.
Despite
today's meteorologists laughing at the idea there is every reason to suppose
that the old cycles are still valid. It is the same world, sun, moon and
planets as they always were. The land is the same and the same old blue sky
still hangs above it. The only thing that has changed is the reluctance of
climate scientists to find ways to better warn the public. So we now have
to do it ourselves.
© Ken Ring 2014